If you’re day trading on Groww or Angel One using raw candlesticks alone, you’ve probably fallen into the classic trap: buying right at the absolute top of a rally or shorting at the exact bottom of a sell-off.
Markets don’t move in a straight line. They expand, contract, and constantly hunt for key liquidity pools.
To consistently spot high-probability intraday reversals before they happen, you need a system that measures two specific things simultaneously: market volatility and hidden institutional price floors.
That is exactly what you get when you combine Bollinger Bands with standard pivot points or Pivot Point standard indicators. In this guide, I will break down how to set up this powerful indicator confluence on your 5-minute TradingView charts, the exact rules for entering high-reward trades, and how to manage your risk like a professional.
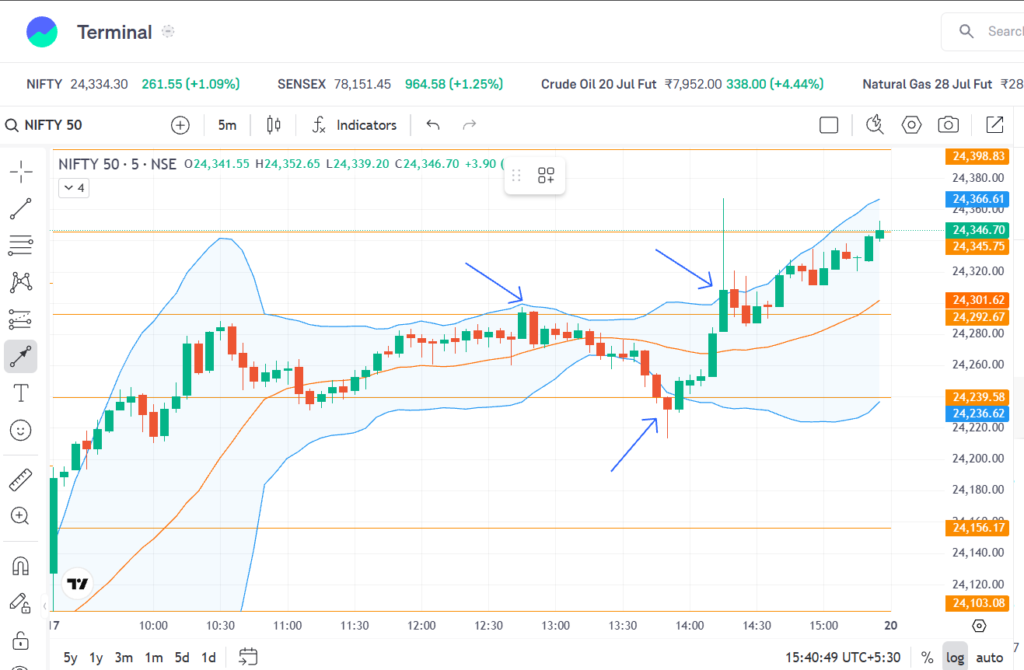
The Setup: Configuring Your Charts on Groww / Angel One
Because both Groww and Angel One terminals utilise the advanced TradingView engine, setting up this workspace takes under a minute.
- Timeframe: Switch your candlestick chart layout to the 5-minute timeframe. This is the optimal window for capturing clean morning and afternoon intraday swings without excessive market noise.
- Add Bollinger Bands (BB): Click the Indicators (fx) tab, search for Bollinger Bands, and add it. Keep the default inputs: length 20 and standard deviation 2. This plots a 20-period moving average baseline wrapped by upper and lower volatility bands.
- Add Standard Pivot Points: Click the Indicators (fx) tab and search for standard pivot points. In the settings menu, make sure the Type is set to Traditional or Standard, and change the time horizon to Daily. This will automatically plot the central Pivot Point (P), along with Support lines (S1, S2, S3) and Resistance lines (R1, R2, R3).
The Strategy: Trading the Volatility Reversal
The core logic of this strategy relies on confluence, meaning we only execute a trade when both indicators line up perfectly to confirm a high-probability reversal zone.
🟢 The Long Setup (Buying Call Options / Longing Equities)
We look for the market to become heavily oversold right at an institutional support floor.
- Condition 1: The price aggressively pushes downward and closes outside or strongly pierces the Lower Bollinger Band. This indicates short-term selling exhaustion.
- Condition 2: The exact price location where the band is pierced matches up perfectly with a daily pivot support line (S1, S2, or S3).
- The Trigger: Wait for a bullish confirmation candlestick (like a hammer, bullish engulfing, or a strong green pin bar) to close on the 5-minute chart.
- Stop-Loss: Place your stop-loss strictly 2 to 3 ticks below the daily pivot support line or the low of the trigger candle.
- Take-Profit: Target the middle Bollinger Band (20 EMA baseline) for your first target and the daily central Pivot Point (P) or R1 for your final target.
🔴 The Short Setup (Buying Put Options / Shorting Equities)
We look for the market to become heavily overextended right at an institutional ceiling.
- Condition 1: The price rallies sharply and closes outside or pierces the Upper Bollinger Band.
- Condition 2: The price location hits a major daily pivot resistance line (R1, R2, or R3).
- The Trigger: Enter the trade on the close of a bearish reversal candlestick (like a shooting star or bearish engulfing candle).
- Stop-Loss: Place your stop-loss 2 to 3 ticks above the resistance line.
- Take-Profit: Target the middle Bollinger Band for your first target and the central Pivot line (P) or S1 for your next target.
Why This Strategy Gives Day Traders an Edge
- Mathematically Defined Risk: You never have to guess where to place a stop-loss. The pivot lines act as hard boundaries. If the price breaks through them, the setup is invalidated, keeping your losses small.
- Prevents Chasing FOMO: When a stock is pumping rapidly, the upper Bollinger band visually shows you that the asset is “expensive”. This keeps you disciplined, forcing you to wait for a short setup at the next Resistance line rather than blindly chasing the green candles.
- High Risk-to-Reward Ratios: Because you are entering right at structural turning points on a 5-minute chart, your risk is tight, while your target space back to the central pivot baseline is wide.
🛑 Risk Management Note: This strategy is incredibly potent during range-bound or moderately trending market days. However, if Nifty or a specific stock enters a “Super-Trend” day triggered by major corporate earnings or global news, price can ride up or down the outer Bollinger bands like train tracks, ignoring pivot lines entirely. Always respect your stop-loss immediately if a pivot level fails to hold!
Leave a Reply