
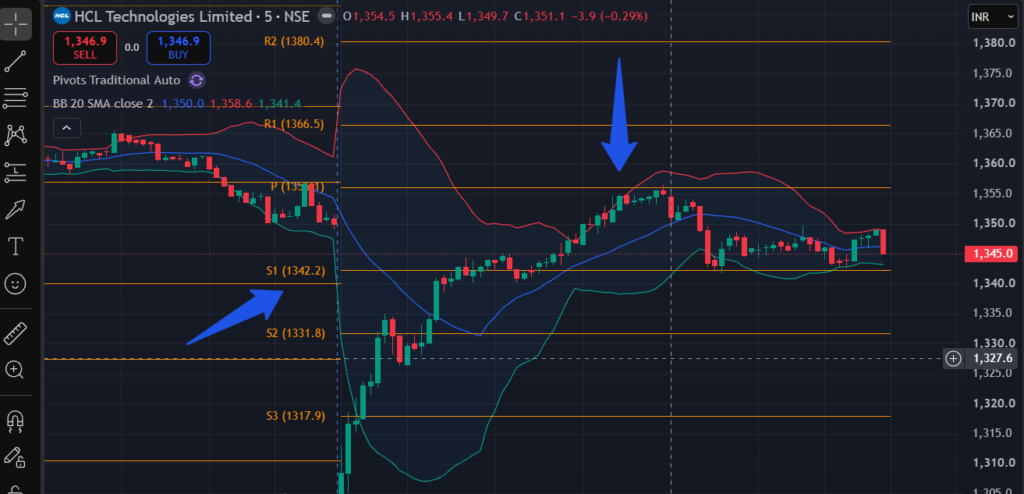
Discover a high-probability 5-minute day trading setup combining Standard
Pivot Points, Bollinger Bands, and key candlestick confirmation patterns. Learn strict risk controls
and precise entry/exit rules.
1. Introduction & Strategy Overview
Day trading demands high precision, systematic execution, and rigorous risk control. Retail traders often fall prey to noise on lower timeframes like the 5-minute chart, taking impulse trades near mid-range levels where probabilities are low. To overcome this, combining a mathematical volatility overlay, Bollinger Bands, with institutional dynamic price levels,, standard pivot points creates a powerful dual-filter trading system.
This strategy leverages the statistical power of mean-reversion (when price stretches outside normal standard deviation boundaries) combined with structural horizontal levels (Pivot Points) where institutional order flow typically resides. By waiting for specific candlestick confirmation signals at the confluence of these two indicators, retail traders gain an edge while strictly limiting exposure.
2. Technical Indicators & Chart Setup
To implement this setup correctly, configure your charting platform (e.g., TradingView, MetaTrader) as follows:
- Timeframe: 5-Minute Chart (Ideal for liquid stocks, index futures, and major Forex pairs).
- Bollinger Bands Settings: Length = 20, Standard Deviation = 2.0 (SMA basis line).
- Pivot Points Settings: Standard Floor Pivots (Daily calculation timeframe). Key levels used: Central Pivot (P), Support (S1, S2, S3), and Resistance (R1, R2, R3).
- Volume / Confirmation: Relative Volume (RVOL) > 1.5 on the trigger candle to confirm institutional participation.
3. Core Trading Mechanics: The Confluence Model
The core concept behind this strategy is Confluence. A standalone Bollinger Band break can be a continuation signal during a strong trend, and a standalone Pivot Point touch can easily be sliced through during high volatility. However, when price simultaneous interacts with BOTH a outer Bollinger Band (2 Std Dev) AND a Daily Pivot Level (S1/S2/R1/R2), the probability of a sharp reaction or mean reversion increases exponentially.
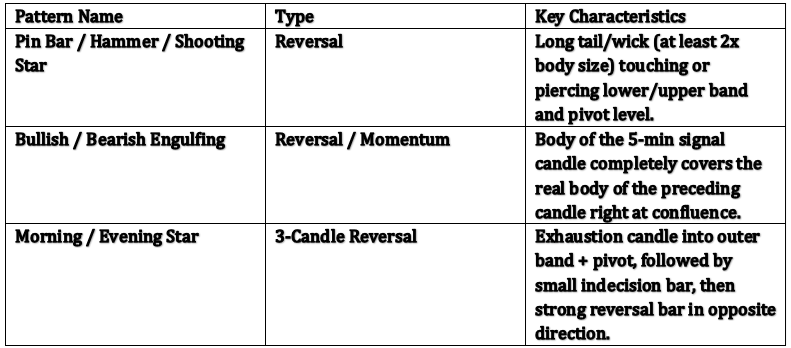
4. Specific Candlestick Trigger Patterns
Do not execute trades purely on indicator touches. You must wait for price action confirmation via one of three primary 5-minute candlestick triggers at the confluence zone:
5. Comprehensive Trade Setup Rules
A. Long (BUY) Setup Rules
- Location Confluence: Price drops to touch or pierce the Lower Bollinger Band AND simultaneously reaches a Daily Pivot Support level (P, S1, or S2).
- Candlestick Trigger: Wait for a 5-minute Bullish Pin Bar, Bullish Engulfing, or Morning Star pattern to complete.
- Entry Execution: Enter LONG at the market open of the next 5-minute candle following the confirmation pattern.
- Stop Loss (SL): Place SL 2-3 ticks below the low of the trigger candle or lower band swing low (whichever is lower).
- Take Profit 1 (TP1): 20-Period Moving Average (Basis Line of Bollinger Bands)—Lock in 50% profits and move SL to Breakeven.
- Take Profit 2 (TP2): Upper Bollinger Band or Next Daily Pivot Level (R1/R2)—Trail remaining position.
B. Short (SELL) Setup Rules
- Location Confluence: Price rallies to touch or pierce the Upper Bollinger Band AND simultaneously reaches a Daily Pivot Resistance level (P, R1, or R2).
- Candlestick Trigger: Wait for a 5-minute Bearish Shooting Star, Bearish Engulfing, or Evening Star pattern to complete.
- Entry Execution: Enter SHORT at the market open of the next 5-minute candle following the confirmation pattern.
- Stop Loss (SL): Place SL 2-3 ticks above the high of the trigger candle or upper band swing high.
- Take Profit 1 (TP1): 20-Period Moving Average (Basis Line) — Close 50% position and move SL to Breakeven.
- Take Profit 2 (TP2): Lower Bollinger Band or Next Support Pivot Level (S1/S2).
6. Strict Risk Management Rules for Retail Traders
No technical strategy guarantees a 100% win rate. Success in day trading relies strictly on position sizing, discipline, and managing downside risk. Retail traders MUST enforce the following guardrails:
- The 1% Risk Rule: Never risk more than 1% of total account equity on any single 5-minute trade setup.
- Minimum Risk-to-Reward Ratio: Do not take trades where potential reward to TP1 is less than 1:1.5 Risk-to-Reward.
- Max Daily Drawdown Limit: If you lose 3 consecutive trades in a single day, STOP trading immediately. Shut down the workstation.
- Avoid Band Walking / Strong Trend Days: When price opens above R2 or below S2 during extreme news catalyst events, Bollinger Bands will expand (‘walk the bands’). Do not attempt counter-trend mean reversion trades in runaway trending markets.
7. Summary Setup Checklist
A 5-minute timeframe was selected
Daily Pivot Points & Bollinger Bands (20, 2) applied
Price touches/pierces outer band AND touches the daily pivot level
A reversal candlestick pattern forms and closes clearly
Position size calculated based on 1% account risk
Stop loss and profit target orders placed simultaneously with entry